AI agents have quietly crossed a line. They are no longer a widget on a help page. They answer customers, look up orders, process returns, and call your internal APIs, thousands of times a day. That makes them production software. And production software gets watched.
The problem is where agent data has lived. Most of it sits in the agent platform's own dashboard, a separate world from the place your engineering team actually monitors the business. When latency spikes or an integration starts failing, the people on call can't see the agent next to the services it depends on. They can't alert on it with the tools they trust, and they can't trace a slow reply back to the step that caused it.
Today we're releasing Maven Telemetry in alpha to change that.
What Maven Telemetry does
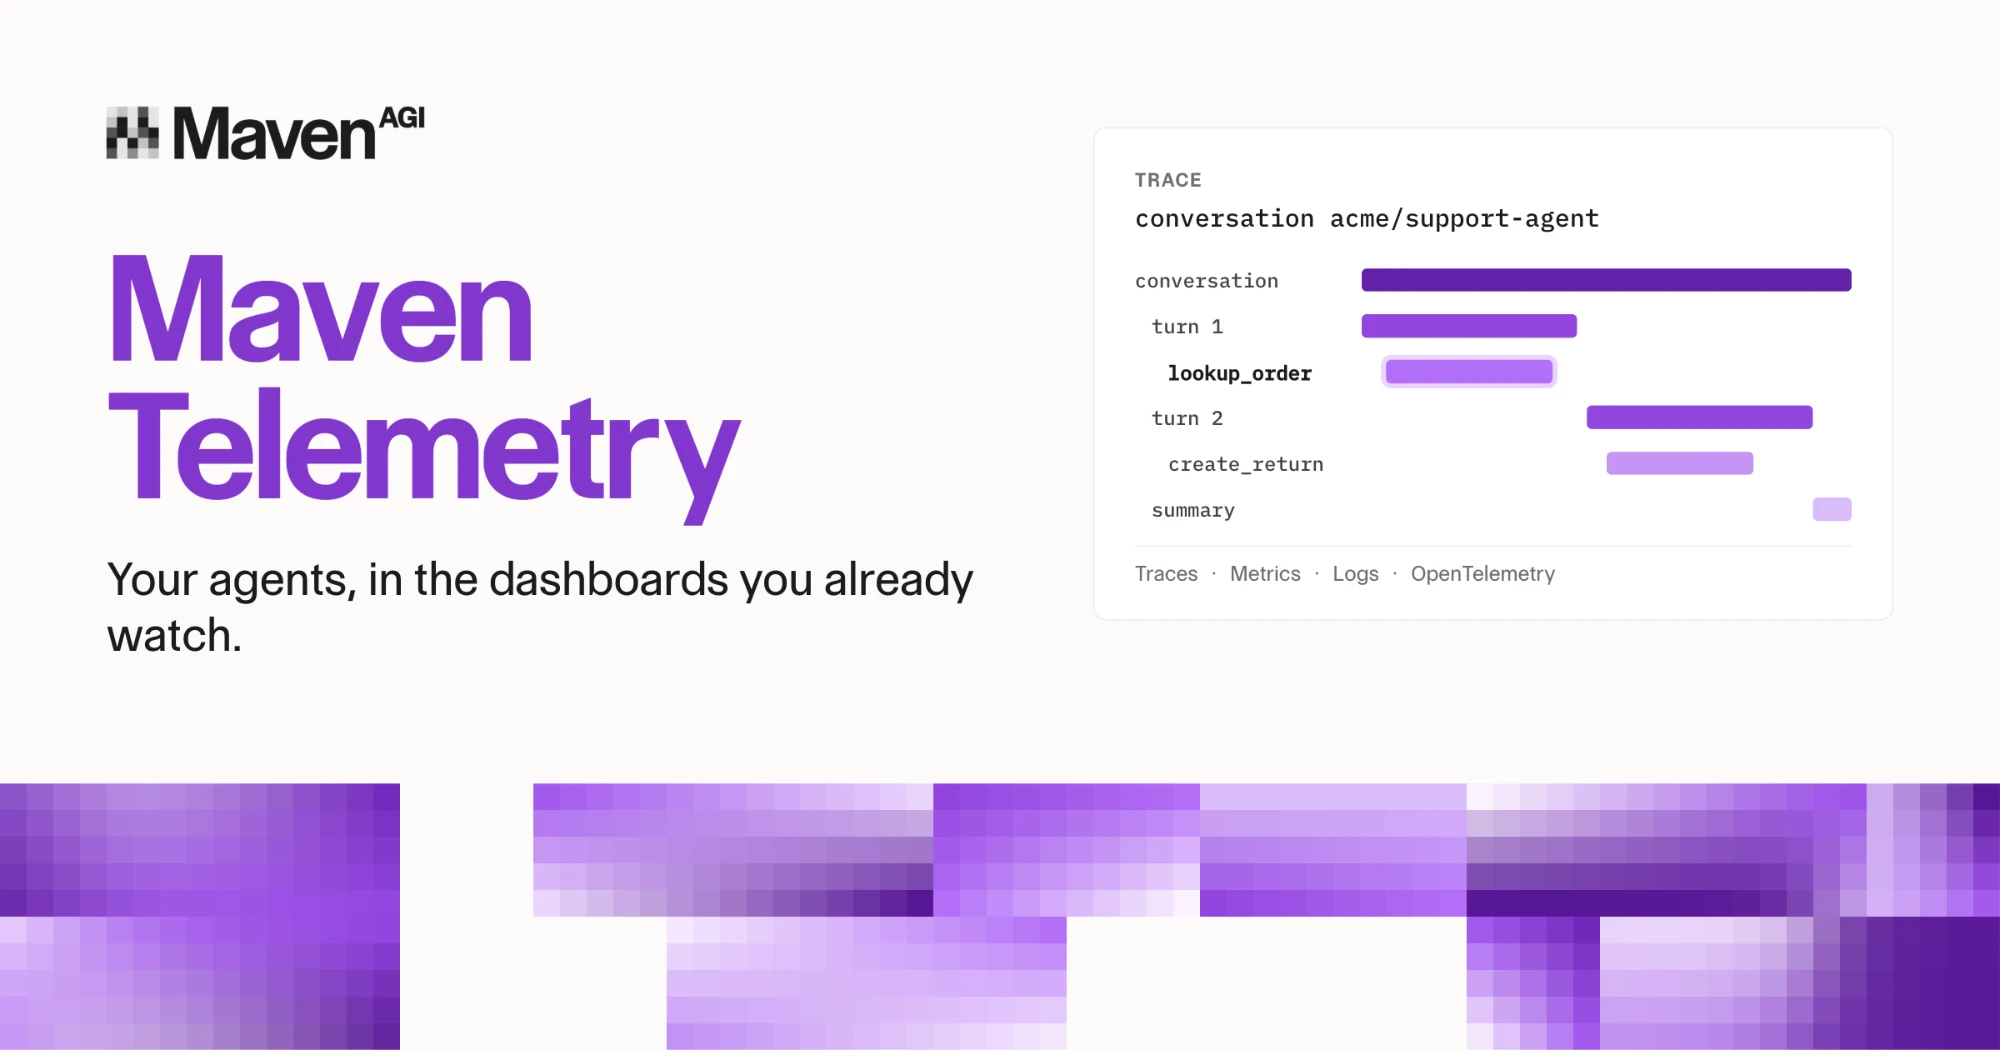
Maven Telemetry is an app in the Maven App Directory. Install it on an agent and it streams that agent's activity to your observability platform over OpenTelemetry (OTLP), the open standard most modern monitoring tools already speak. It sends three kinds of signal.
Traces. Every conversation becomes one trace, named by organization and agent so you can tell agents apart at a glance. Inside it, each turn and each action the agent takes is its own span, with log records for messages, actions, and the conversation summary. If a reply was slow, you can see exactly which action made it slow.
Metrics. Maven's conversation analytics are pushed as metrics every five minutes. Alongside them come latency histograms for actions, turns, and whole conversations, plus how long a human agent took to respond when a conversation was handed off. User counts include everyone your agent talks to, split into anonymous and identified users.
Logs. Maven events arrive as logs, ready for the searches and alerts you already run.
Built for the stack you already have
Setup is designed to take minutes, not a project. Pick your platform from the list — Datadog, Dynatrace, Grafana Cloud, Honeycomb, New Relic, OpenObserve, SigNoz, or Splunk — and Maven Telemetry asks only for the fields that platform needs. You can send the same agent's data to up to five destinations at once, so an SRE team in Datadog and an analytics team in Grafana can both work from the same source.
Prefer to pull instead of push? Each agent can expose a Metrics API in Prometheus, OTLP/JSON, or OTLP/protobuf format, plus a Health API, both protected by a key you set. Leave the key empty and both stay closed.
Private by default
Observability shouldn't come at the cost of control. Conversation text and personal data aren't exported unless you choose to turn them on, so you can start with performance signals and decide later what else belongs in your monitoring tools.
A few other details our engineering team sweated:
- Each region exports only its own data, so residency boundaries hold.
- If the app is missing a permission for one data source, only those metrics are held back. Everything else keeps flowing, and the Health API tells you which permission to grant.
- Every export runs through a single, guarded transport.
Why it matters
When your agent shows up in the same dashboards as the rest of your stack, it can be run like the rest of your stack. Set SLOs on reply latency. Page someone when an action's error rate climbs. Add the agent to your incident runbooks. Put agent performance on the same screen your operations leaders already check every morning.
And because Maven agents work across the whole customer lifecycle, from first question to purchase to renewal, every one of those conversations becomes something your teams can measure and improve.
Get started today
Maven Telemetry is available now in alpha to every Maven organization. Open the App Directory, install Maven Telemetry on your agent, and follow the five-step quick start in our docs. We'd love your feedback while it's in alpha.
Not a Maven customer yet? See what Maven agents can do for your business — book a demo.
See it on your own conversations.
Request a free personalized demo.