

Meet Observatory: stay a step ahead of your agent
Anomaly detection, alerts, and plain-language insights for every Maven agent, ready the moment you install.

Your AI agent interacts with thousands of customers a day. Most days look a lot like the last one. Then one afternoon an integration fails, a policy change confuses buyers, or a promotion doubles your traffic, and nobody notices until the escalations pile up.
Today we're launching Observatory, a Maven app that watches your agent's conversations around the clock. It learns what a normal day looks like for your agent, flags anything out of the ordinary, and tells you about it by email, Slack, webhook, or your Maven inbox.
Dashboards tell you what happened. They don't tell you when to worry.
As AI agents take on more of the customer lifecycle, from answering questions to processing returns to closing a sale, the cost of a quiet failure grows. A broken action or a dip in resolution rate can run for hours before anyone opens a dashboard.
The usual fix is a static alert: page me if conversations drop below 200 an hour. But conversation traffic is cyclical. A flat threshold calls every Sunday night an outage and every Monday lunchtime a surge, so teams either drown in false alarms or turn alerts off.
CX leaders need something that knows their agent's rhythm and only speaks up when something is actually wrong.
Meet Observatory
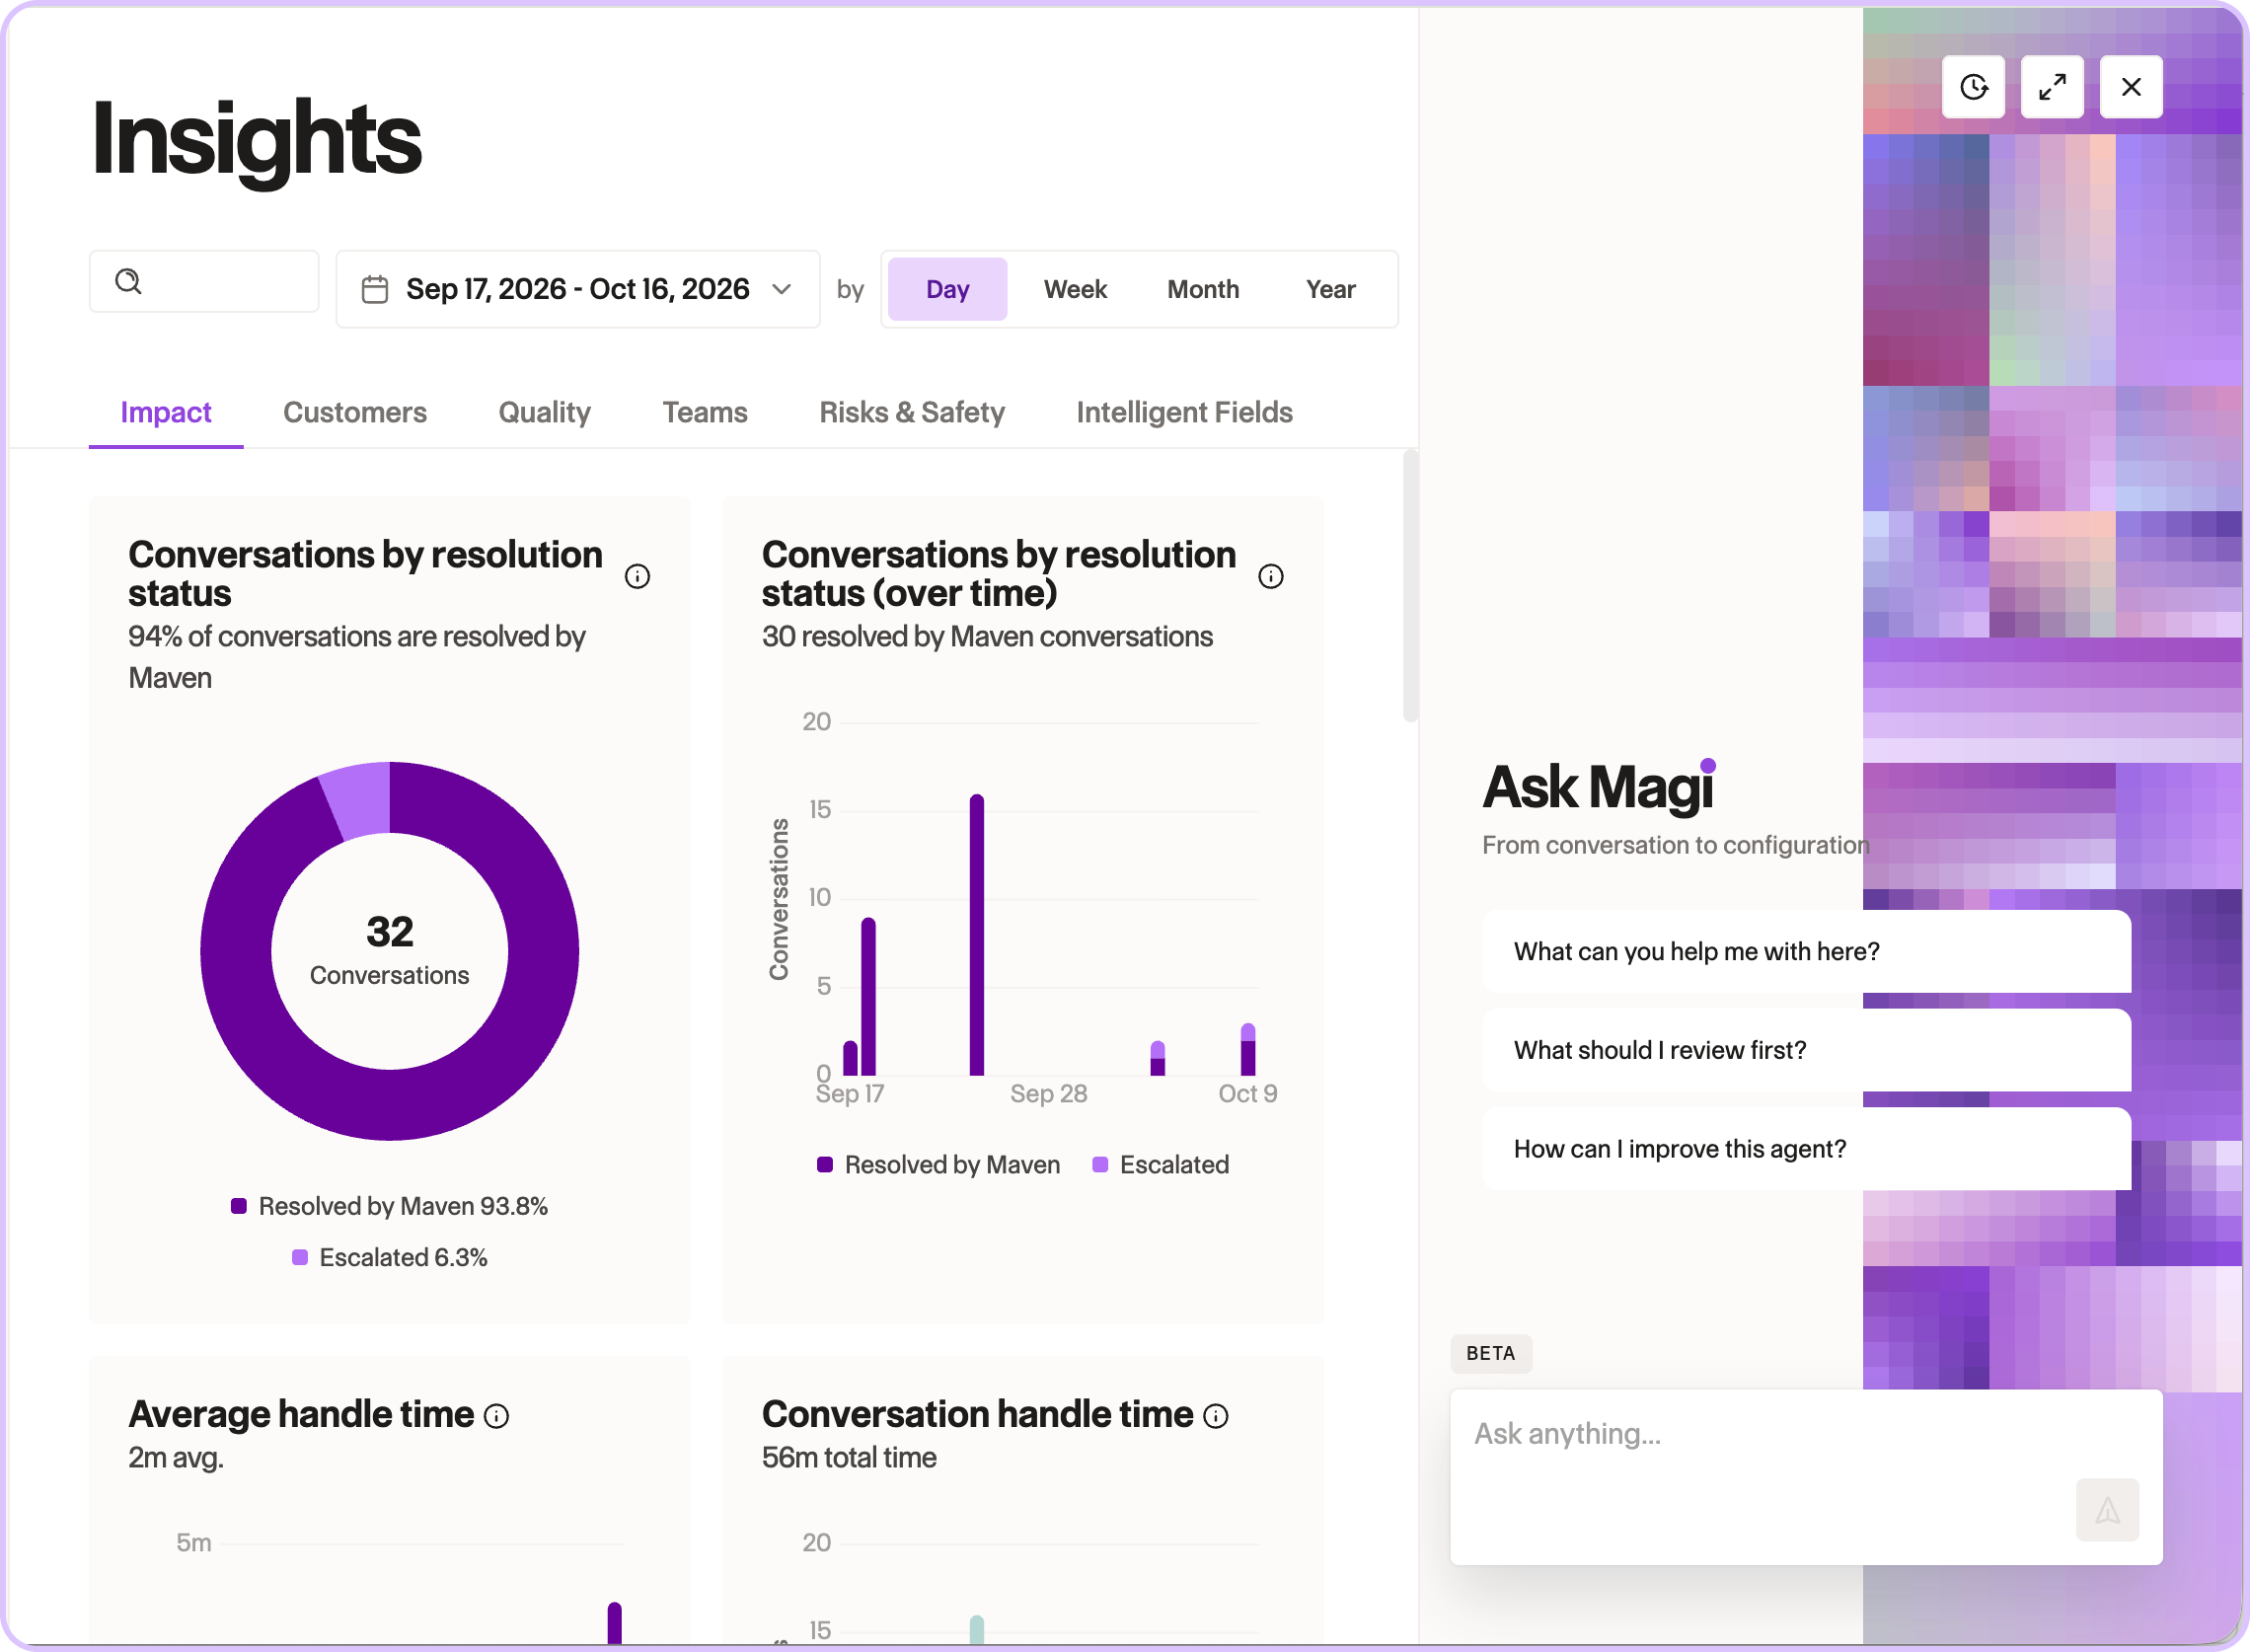
Observatory is an app in the Maven App Directory that monitors your agent's conversation analytics. Install it on any agent in Agent Designer and it opens on an Overview of the metrics that matter most, in your agent's own time zone.
From there, Observatory does three jobs:
- Watches. It charts every metric against the range your agent usually falls in, so anything outside that range stands out.
- Alerts. It checks on a cadence and tells your team the moment something breaks from the norm.
- Explains. Maven reads your charts and writes a plain-language summary of what changed and what's worth a closer look.
How it works
Anomaly detection that knows your agent's normal week
Observatory compares every hour, day, or week with comparable earlier periods. Mondays are judged against Mondays and quiet nights against quiet nights, so the usual rhythm of your traffic is never mistaken for a problem. If this Monday brings 612 conversations when the last five Mondays averaged about 406, Observatory flags it as a spike.
A few details make the signal trustworthy. A spike is never allowed into its own baseline, so a big anomaly can't hide itself. Public holidays are marked on the chart, so a holiday dip explains itself. And when there isn't enough history to judge, Observatory says "unknown" instead of guessing.
Track the metrics that matter to you
Chart conversations, resolution and escalation rates, handle time, first response time, CSAT, predicted NPS, feedback, action errors, and your agent's own Intelligent Fields. Narrow any chart to one app, one action, or one field value, split it into a line per value, or compare several agents side by side.
Alerts that reach your team
Turn any chart into an alert. Observatory checks every rule hourly and notifies you by email, in Slack, by webhook to your own tools, and in your agent's Maven inbox. A daily check also reviews every agent's conversations, resolution rate, and action executions with no setup at all.
Some questions are about what's acceptable rather than what's usual, like "CSAT must not drop below 80%." Set a minimum, a maximum, or both, and targets work from the day you install.
See what's coming
Forecast up to two weeks ahead, with the likely range drawn around the projection, so you can staff and plan for a busy week before it arrives.
Explore conversations as a whole
Visual views show what your conversations are about, how each kind goes, where they end up, how one topic flows into another, and when your agent is busiest. Conversation DNA shows the step-by-step shape of recent conversations.
Notebooks, insights, and scheduled reports
Collect charts and views into a notebook with your own notes, keep it private or share it with your team, and send anyone a link to a single chart. Ask Maven for an executive summary, an explanation of the anomalies, or an answer to your own question. Then have the notebook emailed to you and your teammates daily, weekly, every two weeks, or monthly.
Why it matters
When one agent handles support, commerce, and everything in between, its health is your business's health. Observatory turns that agent from something you check on into something that checks in with you.
- Catch issues in minutes, not days. A broken integration or a spike in escalations surfaces on the next hourly check, before it becomes a backlog.
- Fewer false alarms. Seasonal baselines mean your team only hears about moves that are actually unusual.
- One shared view of agent performance. Notebooks and scheduled reports give CX, ops, and leadership the same picture, with Maven's summary of what it means.
Get started today
Observatory is available now in the Maven App Directory. To install it:
- In Agent Designer, open the App Directory, find Observatory, and click Install.
- Choose the agents you want to monitor.
- Open the Overview, then add your team as recipients for the daily check.
Want a walkthrough? Talk to your Maven team or book a demo.


Don’t be Shy.
Make the first move.
Request a free personalized demo.